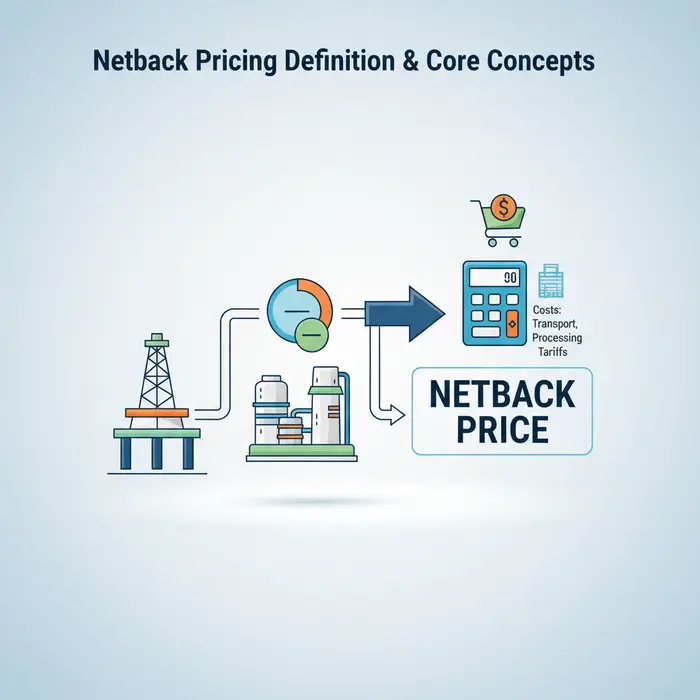
Netback Pricing Definition & Core Concepts
In the complex world of international trade, understanding the true value and profitability of a product is paramount. This is where International Trade Netback comes into play, serving as a critical analytical tool for businesses involved in global commerce. Netback pricing is essentially a reverse calculation that determines the effective revenue a producer receives for their goods at the point of origin, after deducting all costs incurred to bring that product from its source to its final market destination.
Its primary purpose is to provide a clear, apples-to-apples comparison of profitability across different markets, logistics routes, or sales channels. By peeling back layers of costs – from transportation and tariffs to insurance and marketing – businesses gain an accurate picture of the real value of their commodity before it leaves their hands, making it an indispensable concept for strategic decision-making in global supply chains.
1. What is Netback Price?
The netback pricing definition refers to the price of a commodity at a specific point, typically the point of origin or production, calculated by subtracting all subsequent costs from the final selling price at the destination market. It’s an inverse valuation method, moving backward from the consumer market to the producer. Imagine a barrel of oil sold in Rotterdam; its netback price at an oil well in the Middle East would be the Rotterdam price minus all the costs of shipping, insurance, port fees, and other logistical expenses to get it from the well to Rotterdam. This calculation reveals the true revenue the producer receives per unit at their facility, before accounting for outbound journey expenses. It’s a vital metric for determining the inherent commodity netback value and assessing the economic viability of production at the source.
2. Why Netback Matters in Global Trade
For businesses engaged in cross-border transactions, the importance of netback pricing cannot be overstated. It provides a robust framework for import export profitability analysis and strategic planning:
- Informed Decision-Making: Netback helps companies decide which markets to target, which routes to use, and which products to prioritize by showing the real profitability of each option.
- Optimized Pricing Strategy: By understanding the netback value, producers can set minimum acceptable selling prices, ensuring that they cover their costs and achieve desired profit margins.
- Investment Justification: For new projects or expansions, netback analysis helps justify investments by projecting realistic returns based on various market scenarios and cost structures.
- Negotiation Leverage: A clear understanding of netback empowers producers and traders during price negotiations, as they know their bottom line for different destinations.
- Logistics and Supply Chain Optimization: By meticulously breaking down costs, netback analysis highlights inefficiencies in the supply chain, encouraging businesses to seek more cost-effective transportation, insurance, or handling solutions.
- Risk Management: It provides insight into how changes in freight costs, tariffs, or market prices at the destination can impact the producer’s revenue, allowing for better risk mitigation strategies.
For more insights into optimizing your global trade strategies and understanding the intricacies of netback, explore International Trade Netback resources.
3. Key Components of Netback Value
To understand how to calculate netback price, it’s essential to identify the various cost components that are subtracted from the final selling price. These typically include:
- Final Selling Price (Destination Market): This is the price at which the product is sold to the end buyer or distributor in the destination country.
- Transportation Costs: This encompasses all expenses related to moving the product, including sea freight, air freight, road transport, rail charges, and any associated port charges, handling fees, and terminal costs.
- Insurance: Premiums paid for marine cargo insurance or other forms of transit insurance that protect the goods against loss or damage during shipment.
- Taxes and Duties: Import duties, tariffs, customs fees, value-added tax (VAT), and any other local taxes imposed at the destination port or country.
- Marketing and Sales Costs: Expenses incurred in selling the product, such as sales commissions, advertising, promotion, and local warehousing costs at the destination.
- Logistics and Handling Costs: These include costs for customs clearance, documentation, local distribution, warehousing, quality inspection, and any specific handling requirements (e.g., cold chain storage).
- Financing Costs: Any interest charges or fees associated with trade finance, letters of credit, or other payment terms.
The formula is straightforward: Netback Price = Final Selling Price - (Transportation Costs + Insurance + Taxes & Duties + Marketing & Sales Costs + Logistics & Handling Costs + Financing Costs). By meticulously accounting for each of these elements, businesses can accurately assess their profitability and make strategic decisions that enhance their competitive edge in global markets. This comprehensive approach ensures that companies consistently evaluate their commodity netback value, leading to more robust and profitable international trade operations.
The Formula: How to Calculate Netback Price
Understanding the true profitability of a product sold in an international market requires more than just knowing its selling price. It demands a sophisticated approach known as International Trade Netback pricing. This crucial metric strips away all associated costs, providing the actual revenue received by the producer or exporter at their point of origin. For businesses engaged in import export profitability analysis, mastering how to calculate netback price is indispensable for strategic decision-making.
1. Breaking Down the Netback Formula
At its core, the netback pricing definition is straightforward: it’s the price of a commodity at a certain point in the supply chain, minus all costs incurred from that point to the final market. Essentially, it reverses the flow of revenue, calculating backward from the final sale price to the point of origin. This gives you the commodity netback value. The formula is as follows:
Netback Price = Final Selling Price – (All Costs from Point of Origin to Final Market)
Let’s unpack these components:
- Final Selling Price: This is the price at which your product is ultimately sold to the end customer or distributor in the destination market. It’s the revenue generated before any deductions.
- All Costs from Point of Origin to Final Market: This encompasses every single expense incurred after the product leaves your facility until it reaches the buyer. Accurately identifying and totaling these costs is the most critical and often the most complex part of the calculation.
By subtracting all these costs from the final selling price, you arrive at the price you effectively “net back” at your production or dispatch point. This figure allows you to compare the profitability of selling to different markets, using different logistical channels, or through various intermediaries, providing a clear picture of your effective revenue.
2. Identifying All Costs: From Production to Delivery
The accuracy of your netback calculation hinges on a comprehensive identification of all relevant costs. Overlooking even minor expenses can significantly skew your import export profitability analysis. These costs can be broadly categorized, but it’s vital to consider every specific charge related to your unique product and supply chain. Here’s a breakdown of common costs:
- Logistics and Transportation: Inland freight (from origin to port), ocean/air freight (main international leg), destination inland freight (from port to buyer), port charges (terminal handling, wharfage at both ends).
- Customs & Documentation: Customs brokerage fees for clearance, costs for certificates of origin, quality control, phytosanitary certificates, etc.
- Duties and Taxes: Import duties/tariffs levied by the importing country, Value Added Tax (VAT) or Goods and Services Tax (GST) in the destination market, and other specific levies.
- Insurance: Cost to protect goods against damage or loss during transit.
- Financing Costs: Interest on trade finance, letter of credit fees, bank charges.
- Packaging and Labeling: Costs for export-specific packaging and compliance labeling requirements.
- Sales and Marketing Costs: Commissions, advertising, or promotional expenses specifically tied to the international sale.
- Contingency: A small buffer for unforeseen expenses, often a percentage of total costs.
The International Chamber of Commerce (ICC) Incoterms provide a globally recognized framework for defining responsibilities and costs between buyers and sellers in international trade. Familiarity with these terms (e.g., EXW, FOB, CIF, DDP) is essential for accurately allocating and identifying who bears which costs in your netback calculation.
3. Practical Calculation Examples
Let’s illustrate how to calculate netback price with a hypothetical scenario for a “commodity netback value” example – say, a container of specialty coffee beans exported from Vietnam to a distributor in Germany.
Scenario:
- Final Selling Price (per container in Germany): $50,000
Identified Costs (per container):
- Inland Freight (Vietnam farm to Port Ho Chi Minh): $500
- Origin Port Charges (Ho Chi Minh): $300
- Ocean Freight (Ho Chi Minh to Hamburg): $2,500
- Marine Insurance: $200
- Customs Brokerage (Germany): $400
- Import Duties (Germany): 5% of final selling price = $2,500 ($50,000 * 0.05)
- VAT (Germany): 7% of final selling price (simplified) = $3,500 ($50,000 * 0.07)
- Destination Port Charges (Hamburg): $600
- Inland Freight (Hamburg to Distributor’s Warehouse): $700
- Quality Inspection Fee (Germany): $150
- Bank Charges/LC Fees: $100
Step-by-Step Calculation:
- Sum all Costs:
$500 + $300 + $2,500 + $200 + $400 + $2,500 + $3,500 + $600 + $700 + $150 + $100 = $11,450 - Apply Netback Formula:
Netback Price = $50,000 – $11,450 = $38,550
The netback price for this container is $38,550. This figure helps the exporter assess the profitability of selling to Germany versus other markets, providing crucial data for optimizing global trade strategies and precise import export profitability analysis.
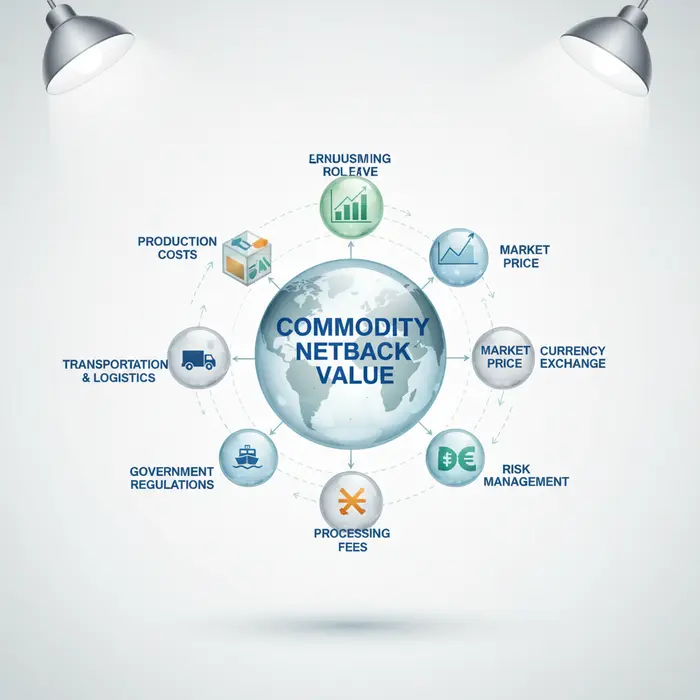
Factors Influencing Commodity Netback Value
Understanding the true profitability of international trade in commodities necessitates a thorough grasp of the International Trade Netback value. This critical metric provides an accurate assessment of revenue after accounting for all costs incurred from the point of sale back to the point of origin. Essentially, it’s a key component in any robust import export profitability analysis, helping businesses determine the viability and attractiveness of various trade routes and markets. While the fundamental ‘netback pricing definition’ refers to the price received by the producer or exporter after all deductions, calculating ‘how to calculate netback price’ involves navigating a complex web of variables. The ‘commodity netback value’ is not static; it’s a dynamic figure constantly influenced by external and internal forces. This section will delve into the primary ‘Factors Influencing Commodity Netback Value’, exploring the market dynamics, logistical hurdles, and geopolitical shifts that shape this crucial financial indicator.
Market Prices & Global Demand
The most direct influencer of commodity netback value is the prevailing market price of the commodity itself, intrinsically linked with global demand dynamics. Market prices for commodities like crude oil, agricultural products, and metals are determined by the delicate balance of supply and demand on international exchanges. High global demand, driven by economic growth or specific industry needs, pushes prices upwards. Conversely, oversupply or a slowdown in global economic activity can depress prices.
Fluctuations in these benchmark prices directly affect the gross revenue component of the netback calculation. A producer of iron ore, for instance, will see their netback value increase significantly if global steel production surges, leading to higher iron ore prices. Moreover, the specific grade and quality of a commodity can fetch different prices, impacting the netback. Long-term trends, seasonal variations, and unexpected events (like extreme weather) can cause sudden shifts in supply-demand equilibrium, making accurate forecasting crucial. Exporters must constantly monitor global economic indicators and geopolitical developments to anticipate price movements and make informed decisions regarding timing of sales and market selection, thereby directly influencing ‘how to calculate netback price’ effectively.
Logistics, Freight, and Insurance Costs
Beyond the initial sale price, the cost of moving commodities from origin to destination significantly erodes potential netback. This category encompasses a wide array of expenses, making it a critical factor in ‘import export profitability analysis’.
Freight Costs: These are charges for transporting the commodity by sea, land, or air. They are influenced by fuel prices, vessel availability, shipping routes, and port congestion. For bulk commodities, slight variations in freight rates can substantially impact the ‘commodity netback value’. A surge in global container shipping rates, as recently observed, can drastically reduce net profit for many exporters.
Insurance Costs: Protecting against loss or damage during transit is essential. Premiums vary based on the commodity’s value, route risk, mode of transport, and covered perils (e.g., theft, natural disasters). Higher risk translates to higher premiums, directly reducing the netback.
Other Logistical Expenses: This includes port handling fees, warehousing, customs clearance, inspection, and documentation fees. These administrative and operational costs, while sometimes overlooked, accumulate and can significantly diminish the final ‘netback pricing definition’ for the exporter. Efficient logistics management, including optimizing routes and negotiating favorable rates, is paramount to safeguarding and enhancing the International Trade Netback.
Currency Fluctuations & Tariffs
The global nature of commodity trade means transactions often involve multiple currencies and are subject to varying trade policies, both profoundly impacting the ‘commodity netback value’.
Currency Fluctuations: When a commodity is priced in a currency different from the exporter’s local currency, exchange rate movements introduce significant volatility. A weakening of the buyer’s currency against the seller’s currency after a deal is struck, but before payment, can reduce actual revenue in the exporter’s local currency, lowering the netback. Conversely, a strengthening of the buyer’s currency can enhance the netback. Businesses engaged in International Trade Netback must employ hedging strategies or currency risk management to mitigate these exposures and ensure predictable profitability.
Tariffs and Duties: These are taxes imposed by governments on imported or exported goods. Tariffs directly increase the cost of a commodity at its destination, which can either be absorbed by the buyer or passed back to the seller as a lower netback. New tariffs or changes in trade agreements can immediately alter the competitive landscape and profitability. Trade wars, for instance, can make certain trade routes economically unviable, complicating ‘how to calculate netback price’ accurately. Understanding international trade agreements and tariff schedules is crucial for maintaining healthy ‘import export profitability analysis’.
International Trade Netback for Profitability Analysis
In the intricate world of global commerce, understanding the true profitability of import and export operations goes beyond merely subtracting production costs from sales revenue. Businesses engaged in cross-border trade face a myriad of fluctuating variables, from shipping expenses and tariffs to local distribution costs. This is where International Trade Netback emerges as an indispensable analytical tool. At its core, the netback pricing definition refers to the effective revenue received by a seller after all costs associated with bringing a product from its point of origin to its final market destination have been deducted from the final selling price. It provides a crystal-clear picture of the actual profit margin on a per-unit basis, offering a powerful lens for import export profitability analysis. By learning how to calculate netback price, businesses gain the ability to make informed, strategic decisions that enhance their financial performance and competitive edge in the global marketplace.
1. Comparing Export Routes & Markets
One of the primary applications of International Trade Netback is its utility in evaluating the viability and profitability of different export markets and transportation routes. A product might command a high retail price in one country, but if the associated shipping, customs duties, and local distribution costs are excessively high, its commodity netback value might be significantly lower than a product sold in a seemingly less lucrative market with efficient logistics. For instance, an exporter of agricultural produce might compare selling to Europe versus Asia. While Europe offers a strong market price, high refrigerated shipping costs and stringent import regulations could erode the netback. Conversely, a nearby Asian market, despite a slightly lower selling price, might offer more favorable shipping rates and fewer bureaucratic hurdles, resulting in a higher netback. By applying netback calculations to each potential market and route, businesses can objectively identify which combinations yield the highest true profit. This analysis empowers companies to prioritize markets, negotiate better freight rates, and ultimately, direct resources towards the most profitable ventures, optimizing their global sales strategy.
2. Optimizing Cost Structures for Higher Netback
Beyond market comparison, International Trade Netback serves as a powerful instrument for dissecting and optimizing a company’s cost structure. Every cost incurred from the factory gate to the customer’s hands directly impacts the final netback price. These costs encompass primary freight, inland transportation, port charges, insurance, tariffs, agent commissions, warehousing, and local distribution expenses. A detailed netback calculation illuminates which cost components are disproportionately eroding profitability. For example, if port demurrage charges are consistently high, it signals a need to review logistics or shipping schedules. Similarly, if a specific market’s import duties significantly reduce the commodity netback value, businesses might explore preferential trade agreements or re-evaluate Incoterms to mitigate these costs. Understanding the impact of each cost element allows businesses to negotiate more effectively with freight forwarders, customs brokers, and insurers, or to streamline their supply chain. For deeper insights into global trade logistics and associated costs, resources like those from the World Trade Organization offer valuable perspectives. Embracing a proactive approach to cost optimization, driven by netback insights, is crucial for sustained competitive advantage and improved import export profitability analysis.
3. Strategic Decision-Making with Netback Insights
Ultimately, the analytical power of International Trade Netback culminates in facilitating robust strategic decision-making. Far from being a mere accounting exercise, netback analysis offers deep insights that can shape a company’s long-term global strategy. For instance, if a consistent netback price trend reveals diminishing returns in a mature market, it might signal the need for market diversification or product repositioning. Conversely, strong netback values in emerging markets could justify increased investment in sales and marketing. Netback insights also influence pricing strategies; rather than setting prices based solely on competitor benchmarks, businesses can establish prices that guarantee a target netback, ensuring sustainable profitability. Moreover, when considering capital investments in new production facilities or logistics infrastructure, projecting potential netback improvements can validate these expenditures. By continuously monitoring and adapting to netback figures, companies can navigate the complexities of international trade with greater confidence, ensuring every export or import decision contributes positively to their bottom line and overall business growth. For more detailed exploration of effective import/export strategies and how to implement them, consider resources on International Trade Netback.
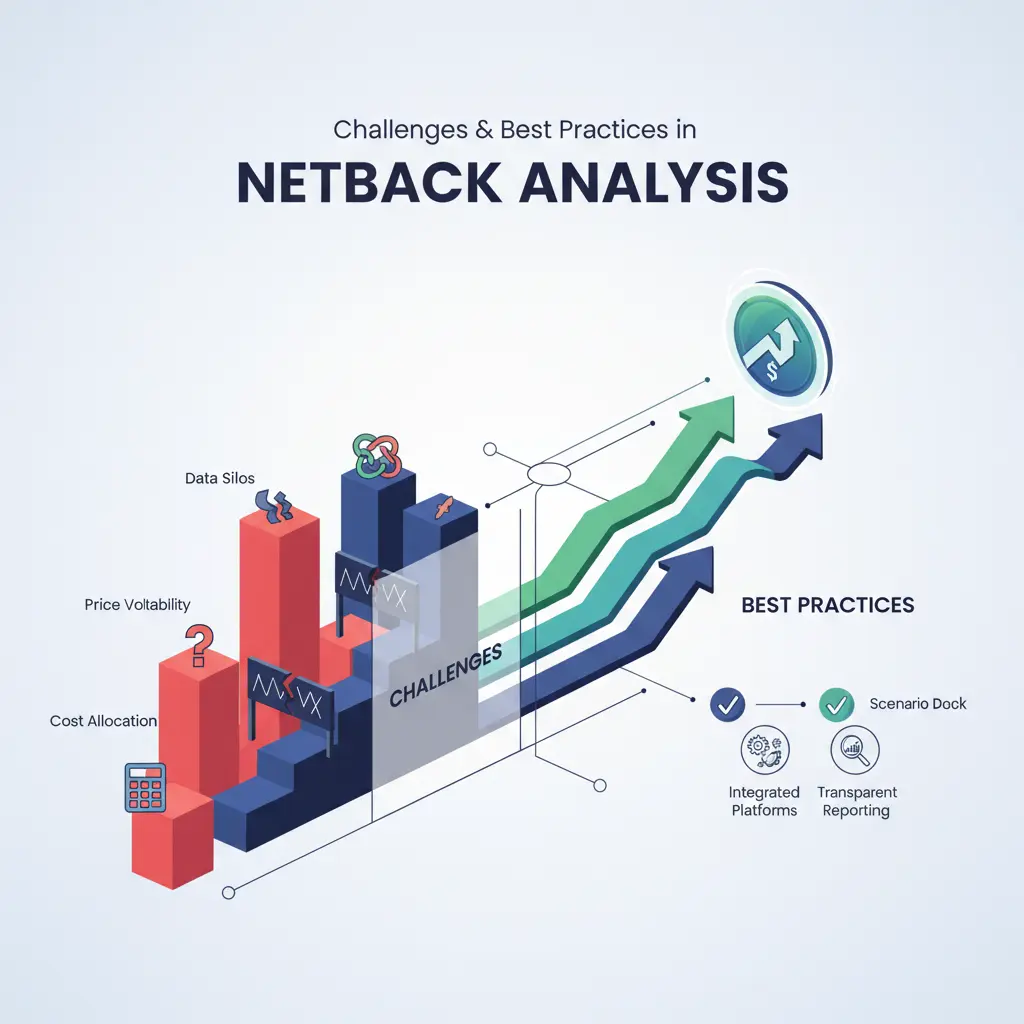
Challenges & Best Practices in Netback Analysis
In the complex world of global commerce, understanding the true profitability of international transactions is paramount. Netback analysis serves as a critical tool, allowing businesses to determine the real value of their goods at the point of origin by subtracting all associated costs from the final selling price. However, conducting a robust International Trade Netback analysis is fraught with challenges, from data inconsistencies to volatile market conditions. This section delves into these common obstacles and outlines actionable strategies for companies to overcome them, ensuring more accurate and insightful import export profitability analysis.
1. Data Accuracy and Transparency Issues
One of the foremost hurdles in achieving an accurate netback calculation is the sheer volume and variability of data involved. From freight, insurance, and handling charges to customs duties, tariffs, and local distribution costs, each element contributes significantly to the final netback value. The challenge intensifies when dealing with multiple suppliers, logistics providers, and regulatory bodies across different countries. Inconsistent data collection methods, a lack of transparency from third-party service providers, and the dynamic nature of currency exchange rates can introduce significant errors, making it difficult to precisely understand how to calculate netback price. Without reliable data, the true netback pricing definition becomes abstract rather than a tangible metric for strategic decisions.
Best Practices:
- Standardize Data Collection: Implement uniform protocols for capturing all cost components, ensuring consistency across departments and international operations.
- Leverage Digital Platforms: Utilize cloud-based systems for real-time data entry and consolidation, minimizing manual errors and providing a centralized source of truth.
- Demand Transparency: Establish clear contractual agreements with logistics partners and suppliers, mandating detailed cost breakdowns and transparent reporting.
- Regular Audits & Reconciliation: Conduct periodic audits of cost data against invoices and market benchmarks to identify discrepancies and ensure accuracy.
2. Mitigating Risks in International Trade
The global trade landscape is inherently unpredictable, exposing businesses to a multitude of risks that can drastically impact their commodity netback value. These include geopolitical instability, natural disasters, logistical bottlenecks, sudden shifts in market demand or prices, and currency fluctuations. Unforeseen events can lead to increased transportation costs, extended storage times, damaged goods, or even contract breaches, all of which erode the potential profit margin calculated in the initial netback analysis. Effectively accounting for these dynamic risks is crucial for maintaining the integrity of netback calculations and ensuring sustainable import export profitability analysis.
Best Practices:
- Robust Risk Assessment: Develop a comprehensive risk management framework that identifies potential threats (e.g., political risk, supply chain disruptions, market volatility) and quantifies their potential impact on netback. The International Chamber of Commerce’s Incoterms® rules are a great resource for clarifying responsibilities and risks in international trade contracts.
- Hedging Strategies: Implement financial instruments like forward contracts or options to mitigate exposure to currency exchange rate volatility and commodity price fluctuations.
- Diversify Supply Chains: Avoid over-reliance on a single region or supplier by developing alternative sourcing and distribution channels, providing flexibility during disruptions.
- Strong Partner Relationships: Foster long-term relationships with reliable carriers, freight forwarders, and customs brokers who can offer timely information and adapt to unforeseen challenges.
3. Tools and Software for Netback Optimization
In an increasingly data-driven world, relying solely on manual spreadsheets for complex International Trade Netback calculations is no longer sufficient. Manual processes are highly susceptible to human error, time-consuming, and lack the ability to process vast datasets or perform dynamic scenario analysis effectively. As businesses scale and their global trade operations become more intricate, the demand for sophisticated solutions that can streamline data, automate calculations, and provide real-time insights becomes critical for maintaining competitive advantage.
Best Practices:
- Invest in Specialized Software: Implement Enterprise Resource Planning (ERP) systems with trade management modules or dedicated netback analysis software. These tools can automate the aggregation of cost data, apply real-time exchange rates, and calculate netback values across multiple products and routes.
- Scenario Planning & Simulation: Utilize software capabilities to run “what-if” scenarios, evaluating the impact of potential changes in freight costs, tariffs, or selling prices on the final netback. This aids strategic decision-making and risk preparedness.
- Integration with Existing Systems: Ensure seamless integration with accounting, inventory, and sales systems to maintain a consistent flow of data and provide a holistic view of profitability.
- Customizable Reporting & Dashboards: Leverage analytical tools to generate customizable reports and intuitive dashboards, offering clear visualizations of netback performance, identifying trends, and highlighting areas for optimization.
By proactively addressing these data, risk, and technological challenges, businesses can transform their netback analysis from a reactive exercise into a powerful strategic tool. A robust and accurate netback calculation not only illuminates true profitability but also empowers companies to make informed decisions regarding sourcing, pricing, logistics, and market entry, ultimately driving sustainable growth in the dynamic world of international trade.
Partner with Vietnam’s Leading Suppliers
Looking for reliable suppliers in Vietnam? Contact VietnamSuppliers.com today to connect with verified manufacturers and exporters across all industries.
—————————————
References
– Investopedia: Netback Value: https://www.investopedia.com/terms/n/netbackvalue.asp
– ICC Incoterms rules: https://iccwbo.org/resources-for-business/incoterms-rules/
– WTO News on Commodity Prices: https://www.wto.org/english/news_e/pres22_e/pr906_e.htm
– World Trade Organization: https://www.wto.org/english/tratop_e/tradfa_e/tradfa_e.htm
– International Chamber of Commerce Incoterms® rules: https://www.iccwbo.org/resources-for-business/incoterms-rules/